Welcome to the world of Fibonacci retracement levels—a powerful tool in the arsenal of traders worldwide. Understanding and effectively utilizing Fibonacci retracements can elevate your trading game to new heights, offering insights into potential price reversals, support, and resistance levels. Let’s delve into what Fibonacci retracement levels are, how they work, and how you can integrate them into your trading strategy on Binomo.
What are Fibonacci Retracement Levels?
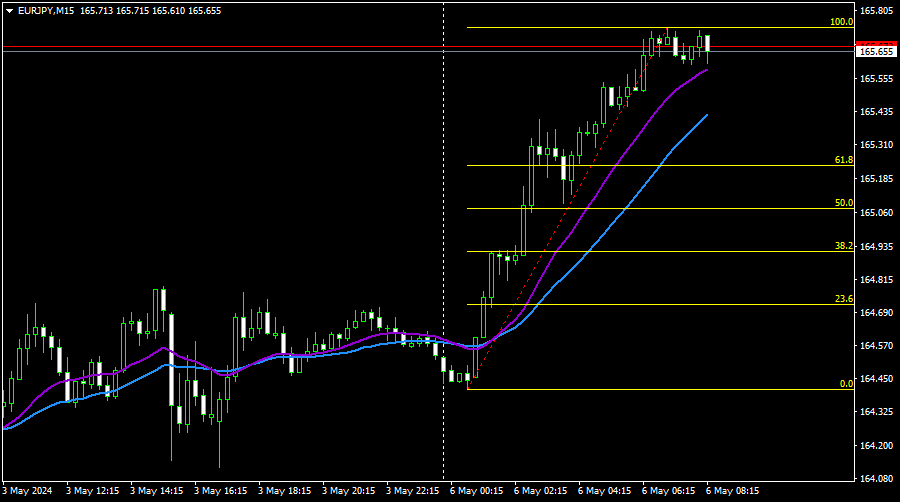
Fibonacci retracement levels are horizontal lines placed on a trading chart to indicate potential areas of support and resistance. These levels are based on the Fibonacci sequence—a series of numbers where each number is the sum of the two preceding ones. In trading, the key Fibonacci levels are 23.6%, 38.2%, 50%, 61.8%, and 100%.
How Do Fibonacci Retracement Levels Work?
The premise behind Fibonacci retracement levels is rooted in the idea that markets often retrace a portion of a previous trend before continuing in the original direction. These retracements can be attributed to the psychology of traders and the natural ebb and flow of market sentiment.
When a price trend is established, traders use Fibonacci retracement levels to identify potential levels of support (during an uptrend) or resistance (during a downtrend) where the price may reverse direction or experience a significant pullback. These levels serve as valuable reference points for traders looking to enter or exit positions.
Integrating Fibonacci Retracement Levels
into Your Trading Strategy
Conclusion
Fibonacci retracement levels are a valuable tool for traders seeking to identify potential reversal points and key levels of support and resistance. By understanding how to apply Fibonacci retracement levels effectively, you can enhance your trading strategy and make more informed decisions on the Binomo platform. Remember to combine Fibonacci analysis with other technical and fundamental factors for a comprehensive approach to trading. Happy trading!