Amidst trading practices, Stochastic stands out as a favored technical indicator, devised by George C. Lane of Chicago. It falls within a category of indicators determined over a fixed number of time periods, with its values oscillating within a predefined range around the central line. Novice traders often grapple with interpreting Stochastic signals accurately across different market scenarios. Misreading market conditions can lead to false signals from the oscillator, a pitfall many newcomers encounter by applying Stochastics indiscriminately. Let's delve into how this indicator generates signals and how to interpret and apply them correctly across varying market conditions.
How does the Stochastic indicator operate?
According to George Lane, the creator of the Stochastic indicator, it measures price momentum. He likened it to observing a rocket's momentum decrease before it begins to descend—a shift in momentum typically precedes a price change. Unlike more intricate technical indicators, the Stochastic oscillator's formula is relatively straightforward.
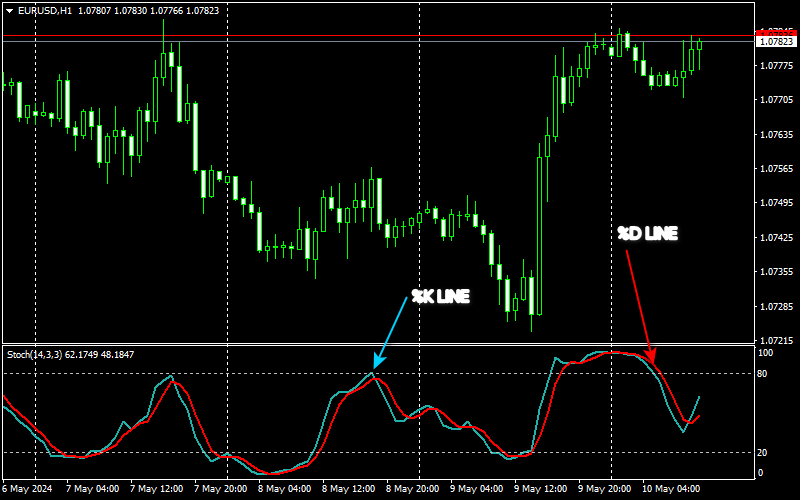
Upon examining the Stochastic settings on any charting platform, one will notice two distinct lines denoting the %K and %D period values, computed using the following formula: Lowest price = minimum price value over a specified period. Highest price = maximum price value over a specified period.
In its default setting, stochastic computations typically span 5 periods. Nonetheless, a majority of traders opt for the assessment of
stochastics over a span of 14 periods, which might entail, for instance, 14 days when examining a daily chart or 14 hours when scrutinizing
an hourly chart. It's prudent to factor in the volatility inherent in the trading instrument. Given that volatility fluctuates depending on
the currency pair under consideration, one might endeavor to tailor the period configurations to enhance the efficacy of the stochastic
signal relative to price fluctuations.
As a novice, adopting the 14-period configuration could serve as a solid starting point. However, for
those with a modicum of trading experience, dedicating time to the assessment and experimentation of one's chosen trading instrument in
order to ascertain the optimal period for stochastic value computation would be advisable.
Distinguishing between the fast and slow stochastic, we observe that the initial stochastic computation adheres to the previously outlined formula. Nonetheless, some traders within the realm of stocks and commodities perceived the original stochastic formula as overly simplistic. Consequently, they introduced an additional three-period moving average to deliberately decelerate the indicator's responsiveness. By incorporating an extra moving average to impede the pace of the original stochastic formula, the resulting stochastic is denoted as slow.
How can one effectively utilize the stochastic indicator?
The Stochastic Oscillator furnishes traders with a trifecta of signal varieties:
1. Conditions of market overextension or underextension.
2. Intersection of stochastic lines.
3. Discrepancy.
Upon examining the Stochastic settings on any charting platform, one will notice two distinct lines denoting the %K and %D period values, computed using the following formula: Lowest price = minimum price value over a specified period. Highest price = maximum price value over a specified period.
In disparate market scenarios, these signal permutations can undergo diverse interpretation. Hence, it becomes imperative to adeptly discern market conditions prior to endeavoring to decipher stochastic oscillator signals.
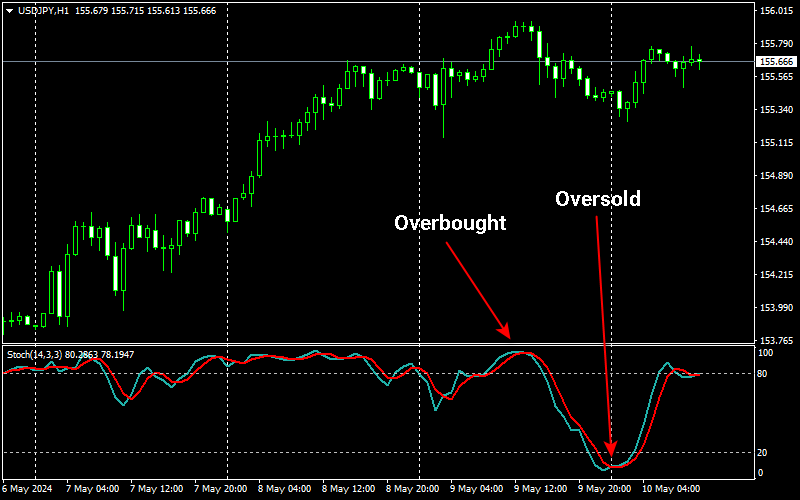
Evaluating market overextension or underextension via stochastics The quintessential stochastic signal oft employed pertains to the overextension or underextension status of the market. As is common knowledge, stochastic metrics oscillate within a range of 0 to 100. Upon surpassing the threshold of 80, the stochastic oscillator denotes an overextension state. This indicates that should one already be entrenched in a long position, it behooves them to commence scaling back their position size or actively pursue avenues for its closure.
Conversely, when the stochastic oscillator descends beneath the 20 mark, it signifies an underextension. This suggests that if one has already assumed a short position, they ought to commence diminishing their position size or actively scout for opportunities to mitigate it.
In the realm of financial analysis, the stochastic indicator is a paramount tool, particularly when assessing overbought and oversold conditions. It's pivotal to recognize that while stochastics furnish reliable cues for overbought and oversold states, their efficacy is most pronounced within range-bound markets. However, in the context of an upward trend, the stochastic swiftly escalates into overbought territory, while in a downward trajectory, it swiftly transitions from oversold status. This phenomenon engenders a semblance of an impending market reversal. Hence, amidst a trending market, it behooves one to incorporate supplementary filters, such as trend lines or alternative trend reversal indicators, to ascertain the veracity of the trend termination afore acting.
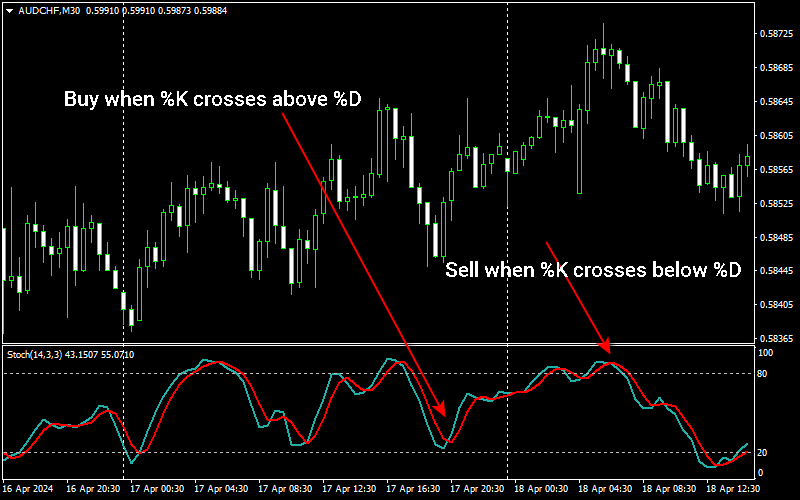
The admonition to heed stochastic signals contrary to prevailing trends cannot be overstated. Employing stochastic crossover signals constitutes the secondary most prevalent technique in trading practices. Such a signal materializes when the %K line traverses the %D line, heralding a buy signal, or conversely, precipitating a sell signal upon %K's intersection with %D.
While stochastic crossover signals hold significant sway within range-bound markets, their reliability dwindles considerably amidst robust market trends. Nonetheless, one may still repose confidence in stochastic crossover signals as harbingers of trend continuation, thereby warranting the initiation of supplementary positions.
In instances where a trading instrument is entrenched in an uptrend and a cross buy signal surfaces in the stochastic, it portends the likely perpetuation of the uptrend, thereby prompting a further ascent in market trajectory. Similarly, a crossover sell signal amid a downtrend furnishes corroborative evidence of the downtrend's probable persistence. Such signals, indicative of trend perpetuation, typically bear reliability during periods of market trends. Nonetheless, prudence dictates the imposition of caution and the integration of additional screening mechanisms prior to contravening prevailing trends predicated on stochastic crossover signals.